
Analiza Capacity
Punkty story na osobę, liczniki WIP, alerty przeciążenia i rozkład obciążenia. Zobacz dokładnie, kto jest przeciążony i gdzie jest dostępna capacity.


Dashboard Analizy Dostarczania
Zamień dane z Jira w praktyczne informacje o dostarczaniu
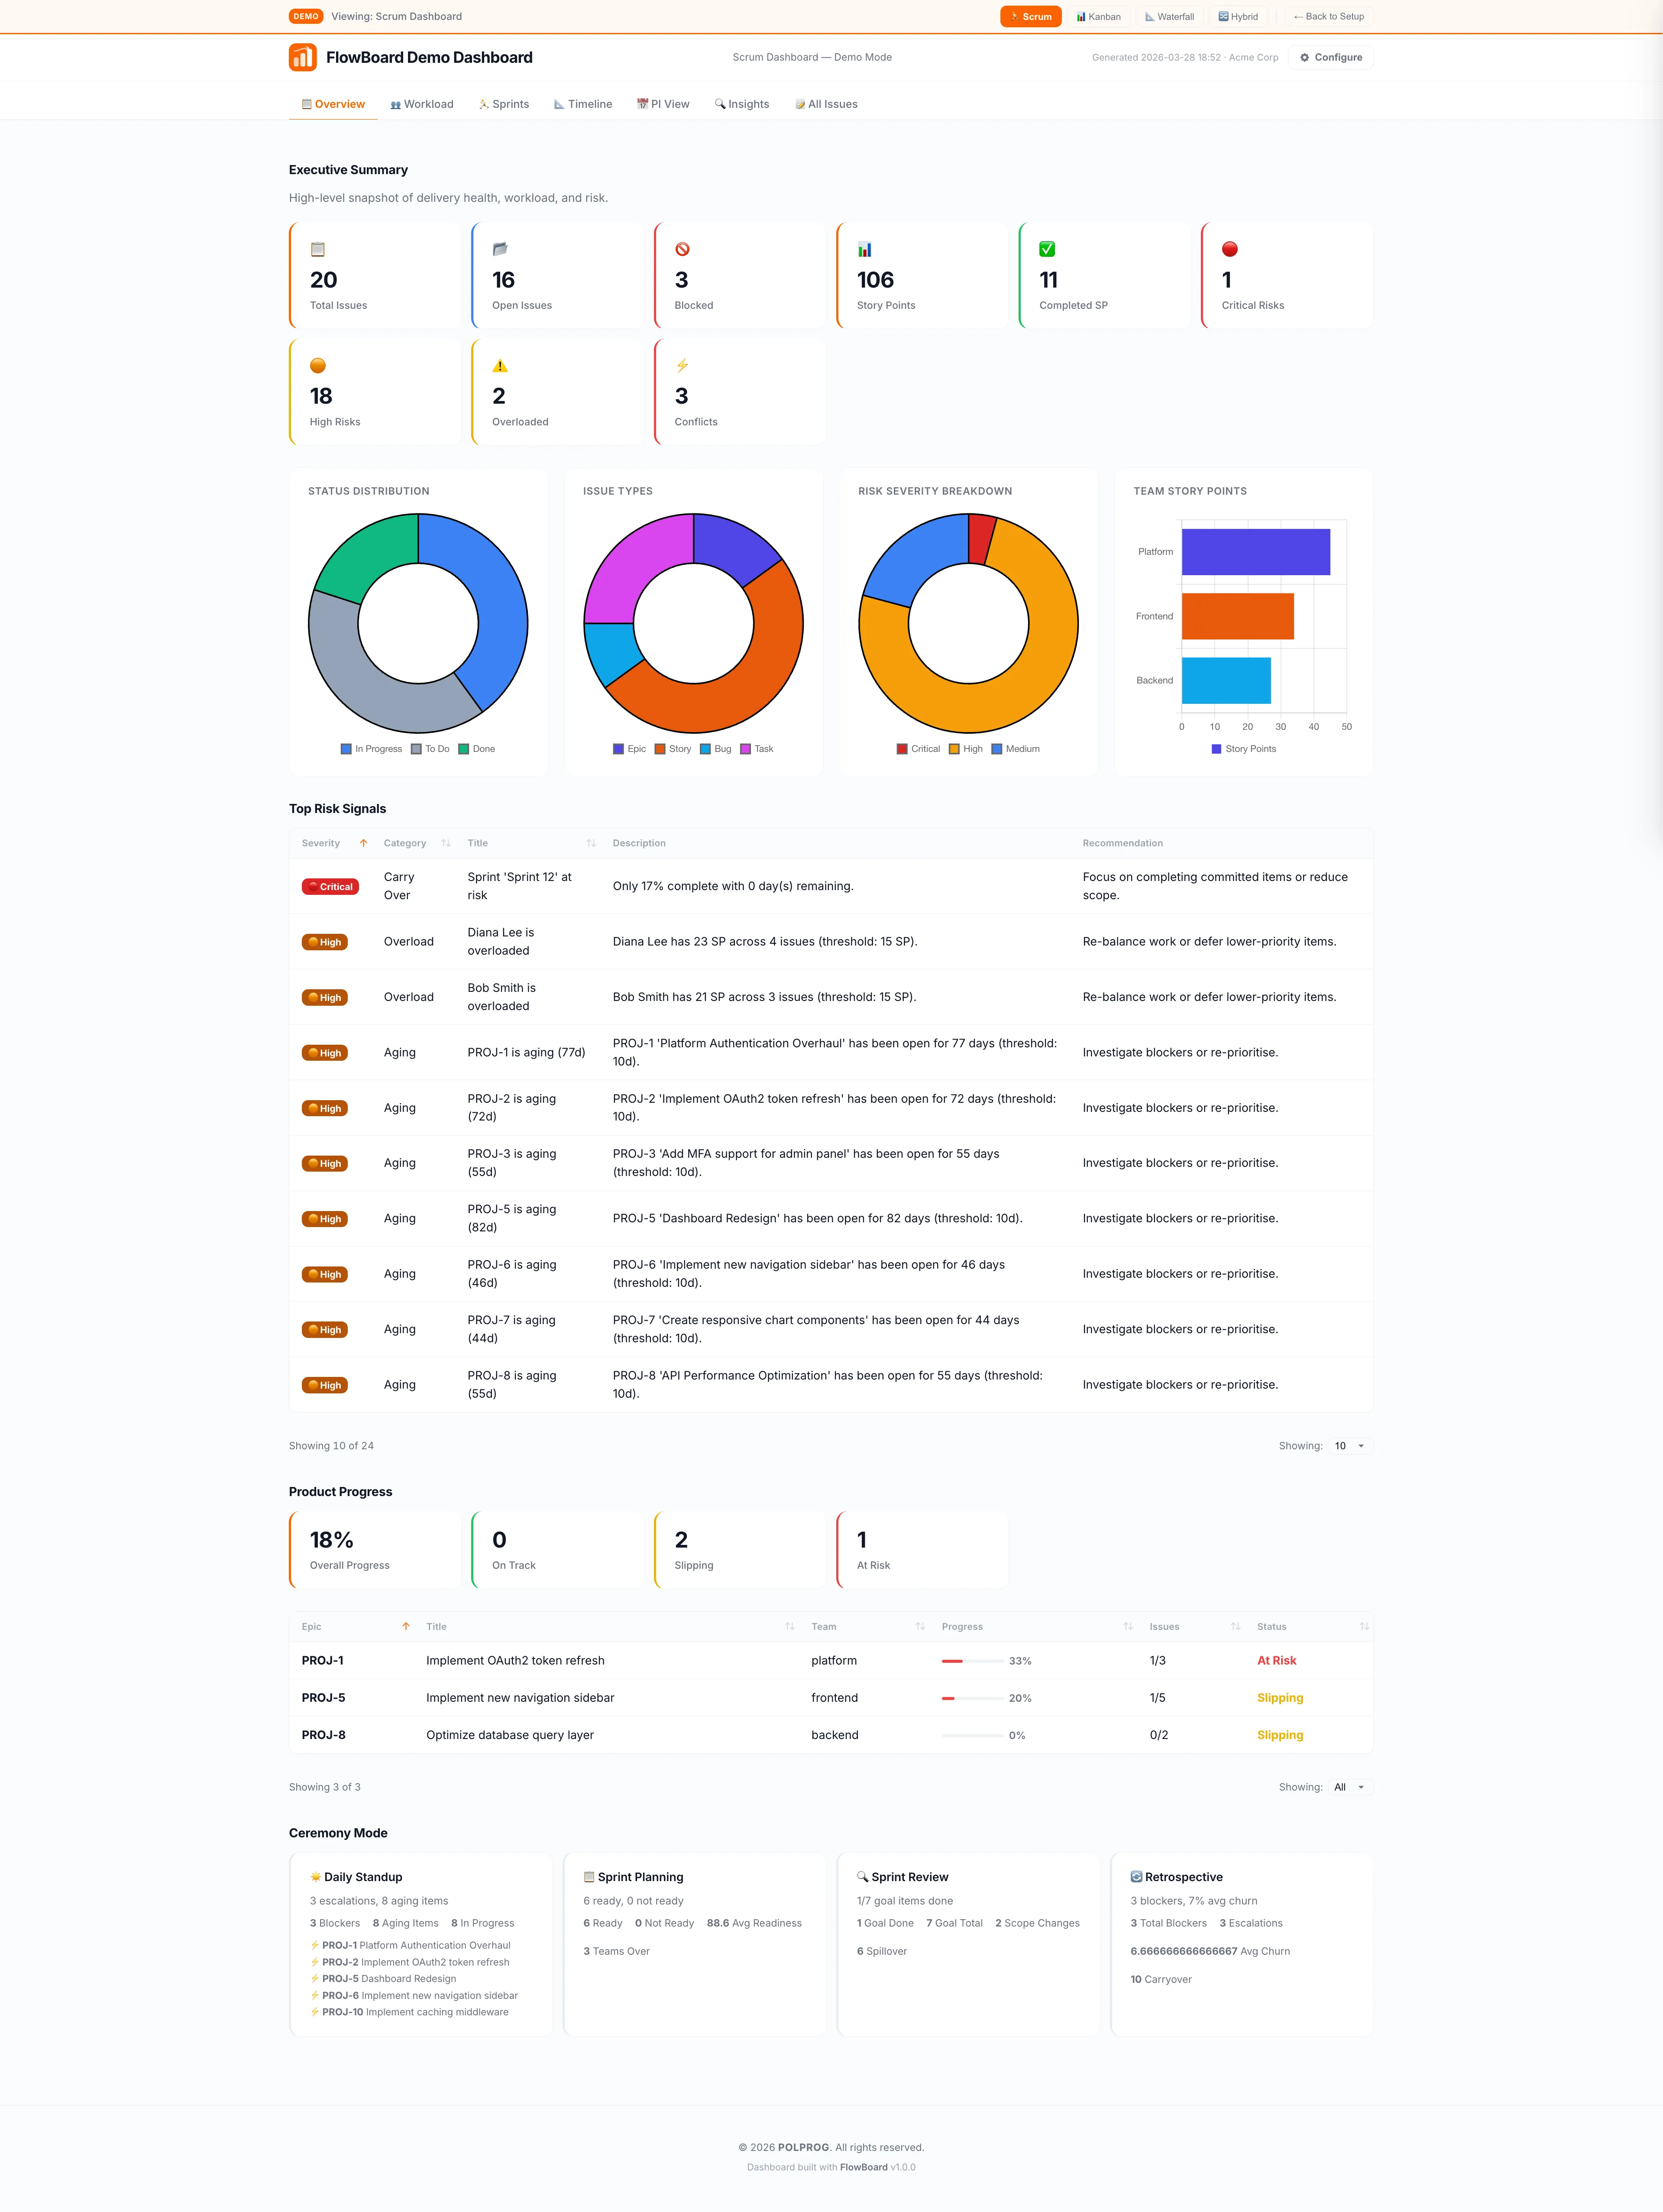


FlowBoard to narzędzie analizy dostarczania oparte na Jira, które generuje samodzielne dashboardy HTML dla menedżerów, Scrum Masterów, Product Ownerów i kadry zarządzającej. Pobiera dane z Jira Cloud, Server lub Data Center, przetwarza analizy lokalnie i tworzy pojedynczy przenośny plik HTML - bez serwera, bez bazy danych, bez infrastruktury. Dashboard odpowiada na kluczowe pytania dotyczące dostarczania: kto jest przeciążony, czy sprint jest na dobrej drodze, czy epiki się opóźniają, gdzie są ryzyka, co się stanie jeśli dodamy zasób. Funkcje obejmują analizę capacity z punktami story na osobę, śledzenie zdrowia sprintu, oś czasu roadmapy z postępem epiców, automatyczne wykrywanie ryzyk w sześciu kategoriach, symulację what-if z natychmiastowymi deltami metryk i analizę konfliktów zasobów.
Najważniejsze możliwości opisane w praktyczny sposób.
Punkty story na osobę, liczniki WIP, alerty przeciążenia i rozkład obciążenia. Zobacz dokładnie, kto jest przeciążony i gdzie jest dostępna capacity.
Paski postępu, zablokowane elementy, starzejąca się praca, ryzyko przeniesienia, analiza zmian zakresu z procentami churnu i tabele capacity vs. commitment na zespół.
Interaktywna symulacja capacity z osiami czasu Gantta przed/po, silnik rekomendacji 'Best Next Hire', gotowe scenariusze i śledzenie redukcji nakładania się.
Automatyczne wykrywanie ryzyk w sześciu kategoriach - łańcuchy zależności, krytyczne blokery, tarcia międzyzespołowe, konflikty harmonogramu, spiętrzenia priorytetów i nakładanie się osi czasu.
Executive, Sprint, Roadmap, Risk i Capacity - każdy dostosowany do konkretnej grupy odbiorców. Tryb ceremonii dla daily i przeglądów z automatycznie rotującymi panelami.
Wizualna oś czasu roadmapy z procentami postępu epiców, znacznikami ryzyka, śledzeniem kamieni milowych i możliwością zagłębiania się w szczegóły poszczególnych epiców.
Generuje pojedynczy przenośny plik HTML z osadzonymi danymi. Otwórz w dowolnej przeglądarce - bez serwera, bez bazy danych, bez infrastruktury. Udostępniaj przez e-mail, Slack lub osadzaj w wiki.
Działa z projektami Scrum, Kanban i Waterfall. Dostosowuje metryki, widoki i terminologię do przepływu pracy Twojego zespołu.
Prosta droga od oficjalnego źródła do pierwszego udanego użycia.
Skorzystaj z jednego z oficjalnych odnośników dostępnych dla Twojego urządzenia lub przeglądarki.
Postępuj zgodnie z instrukcjami sklepu lub otwórz aplikację internetową. Bez zewnętrznych instalatorów.
Sprawdź dostępne opcje, wybierz preferencje i rozpocznij od podstawowego zastosowania.
Przejrzysty opis głównych technologii użytych do budowy i utrzymania produktu.
Twoje dane z Jira pozostają na Twoim komputerze. FlowBoard przetwarza wszystko lokalnie.