
Overview Dashboard
A single-pane-of-glass view across all your projects - sprint velocity, burndown, risk indicators, and team utilisation at a glance.


Delivery Intelligence Dashboard
Sprint health, risk analysis, and what-if simulation - one dashboard.
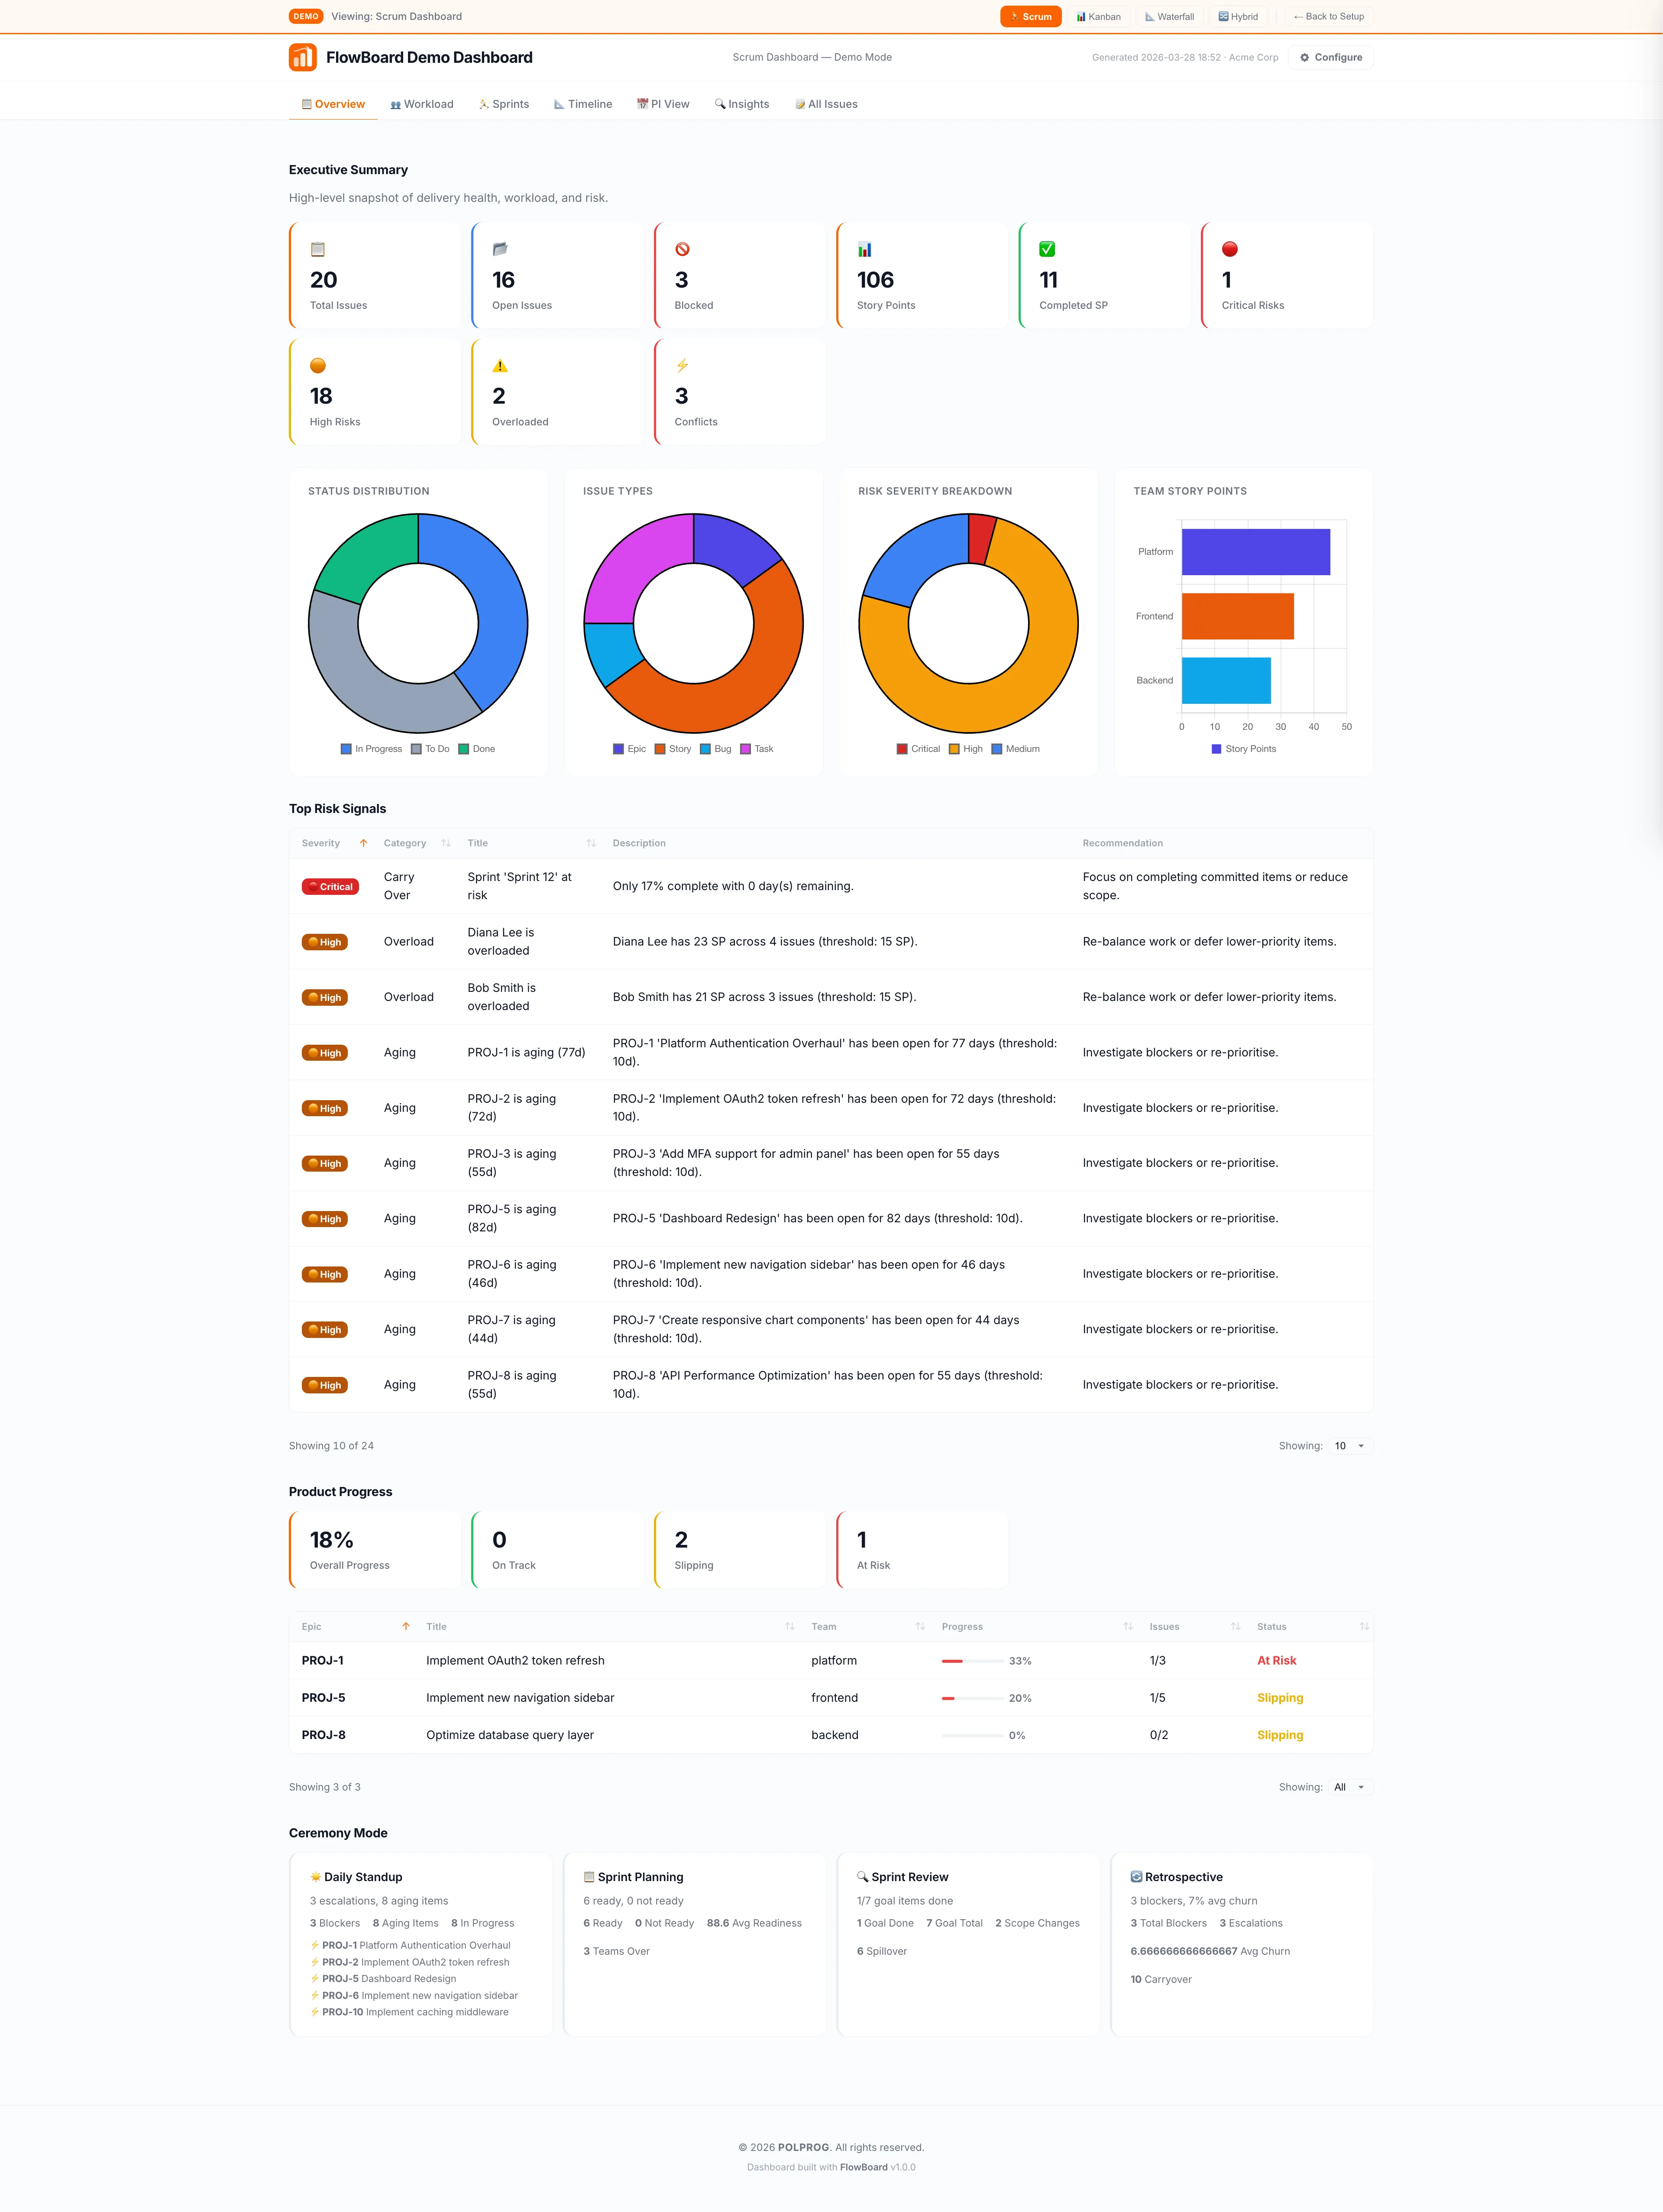


FlowBoard is an open-source delivery intelligence dashboard that gives engineering teams a unified view of sprint health, delivery risk, and what-if scenario simulation. The interactive dashboard provides real-time metrics, goal tracking, and predictive analysis across multiple projects and teams. Features include five dashboard layouts, six risk categories, sprint burndown charts, velocity tracking, scope-change detection, and configurable alerting. A guided setup wizard, JSON configuration with live validation, static HTML report generation, and light/dark themes round out the experience.
The most important capabilities, explained in practical terms.
A single-pane-of-glass view across all your projects - sprint velocity, burndown, risk indicators, and team utilisation at a glance.
Track sprint progress against configurable goals with real-time health scoring and automatic alerts when metrics drift off target.
Model delivery scenarios before committing - adjust scope, capacity, or deadlines and instantly see the impact on projected outcomes.
Six built-in risk categories automatically flag blockers, dependency issues, scope creep, velocity drops, and resource conflicts.
Choose from Executive, Scrum Master, Engineering, Compact, or Default views - each tailored to a different audience and level of detail.
Aggregate metrics from multiple repositories and teams into a single dashboard with per-project drill-down and cross-project comparisons.
JSON-based configuration with live validation, import/export, and full theme support including light and dark modes.
Generate standalone HTML snapshots for stakeholders - share delivery status via email or embed in wikis, no server required.
A clear path from the official source to your first successful workflow.
Use one of the official links available for your device or browser.
Follow the store instructions or open the web application. No third-party installers.
Review the options, choose your preferences and start with the core workflow.
A transparent look at the core technologies used to build and maintain this product.
Your Jira data stays on your machine. FlowBoard processes everything locally.